Images and videos
Images


Ischaemic stroke
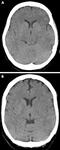
Non-contrast CT scan of brain showing sub-acute isolated left basal ganglion infarction with left frontal horn mass effect
Courtesy of BMJ Case Reports 2009; doi:10.1136/bcr.10.2008.1139
See this image in context in the following section/s:
Ischaemic stroke
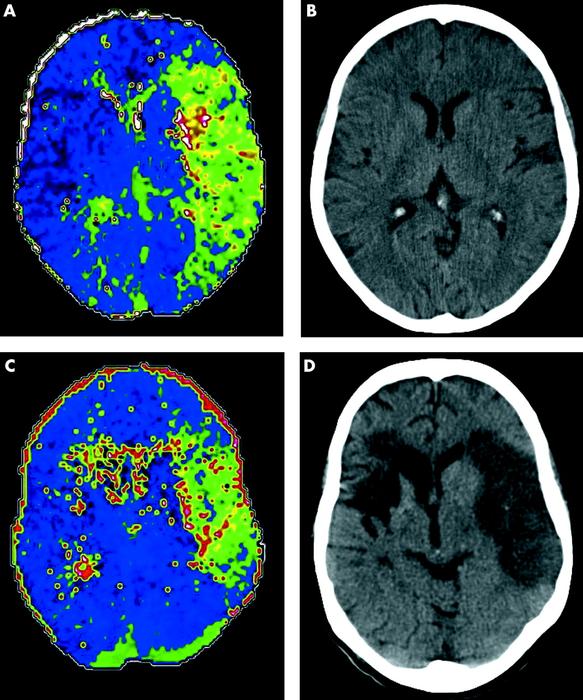
(A) Perfusion CT (time to peak (TTP) map) of acute left MCA ischaemia sub-three hours and (B) equivalent non-contrast CT. Perfusion CT predicts final infarct volume in the absence of arterial recanalisation: (C) three hour TTP map and (D) 24 hour non-contrast CT
Muir KW et al. Neuro 2005; 76: iii19-iii28; used with permission
See this image in context in the following section/s:
Ischaemic stroke
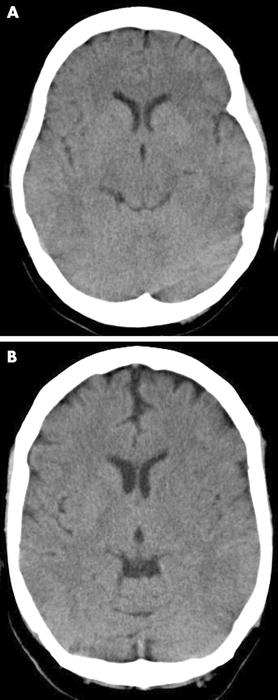
Two examples of early ischaemic changes on CT in sub-three hour ischaemic stroke. (A) Acute left middle cerebral artery (MCA) ischaemia with loss of insular ribbon, and hypodensity of tail of lentiform nucleus. (B) Similar changes in a different patient, with hypodensity of entire lentiform nucleus, some hemispheric sulcal effacement, and compression of lateral ventricle caused by hypodensity of caudate head
Muir KW et al. Neurology, Neurosurgery & Psychiatry 2005; 76: iii19-iii28; used with permission
See this image in context in the following section/s:
Ischaemic stroke
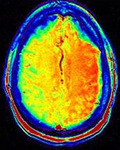
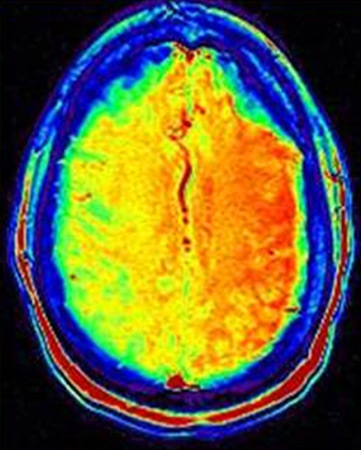
MRI arterial spin labelling image showing extensive hypoperfusion in the right cerebral hemisphere. There is a clear mismatch between diffusion and perfusion
From the personal collection of Eric E. Smith; used with permission
See this image in context in the following section/s:
Ischaemic stroke
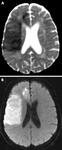
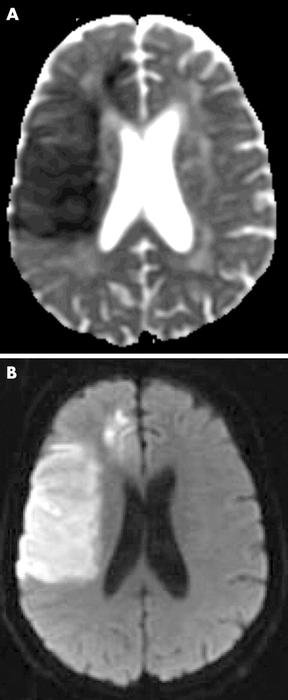
Apparent diffusion coefficient (ADC) map and diffusion weighted MRI (DWI) of subacute stroke (day 3). Restricted diffusion of water leads to decreased signal on ADC, increased signal on DWI
Muir KW et al. Neuro 2005; 76: iii19-iii28; used with permission
See this image in context in the following section/s:

Ischaemic stroke
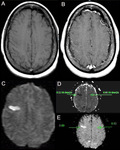
(A) Non-contrast T1-weighted MRI. (B) Post-contrast T1-weighted MRI showing minimal increase in leptomeningeal vessels over the right frontal region. (C) Diffusion-weighted image (DWI) showing a hyperintense area in the right frontal region. (D) Apparent diffusion coefficient (ADC) map shows hypointense lesion, indicating restricted diffusion that correlates with high intensity on DWI and exponential diffusion. (E) ADC value is 0.22 x 10³ mm²/second, corresponding to a hyperacute infarct
From the personal collection of Eric E. Smith; used with permission
See this image in context in the following section/s:
Videos
 Tracheal intubation animated demonstration
How to insert a tracheal tube in an adult using a laryngoscope.
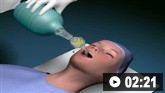
 Bag-valve-mask ventilation animated demonstration
How to use bag-valve-mask apparatus to deliver ventilatory support to adults. Video demonstrates the two-person technique.
Use of this content is subject to our disclaimer